
Divorce Rate Statistics
According to the most recent U.S. Census and national studies, the divorce rate in the United States is approximately 2.4 divorces per 1,000 people. Divorce rates vary significantly based on age, income level, education, occupation, and geographic location.
Based on the latest U.S. Census and national marriage studies, these divorce rate statistics highlight trends across age, income, and location.
Getting a divorce signifies the end of a marriage. It can have drastic impacts on you and your spouse, as well as any children you share. While divorce isn’t always preventable, understanding divorce statistics and potential risks can help you navigate marital challenges. Explore key divorce rate statistics, including prevalence and common reasons for divorce, in this guide from The Law Offices of Travis R. Walker, P.A.
Your wedding vows may have included a promise to stay together through thick and thin until the end of your lives. However, time can change many things, including your relationship with your spouse. Disagreements over money, parenting responsibilities, or simply growing apart can all lead to the dissolution of a marriage.
The Law Offices of Travis R. Walker, P.A. offers this exploration into divorce rate by age, divorce rate in America by age, divorce rates by income level, and divorce rate by gender to help you understand the factors that affect marital stability. Learn the top reasons for divorce, current divorce statistics, and a few tips for strengthening your marriage.
Why Do Marriages End? (Top Reasons for Divorce)
What Are the Top Reasons for Divorce?
A study of divorced individuals cited multiple reasons contributing to their decision to divorce. Some of the most common factors include:
Lack of Commitment
As time passes, couples may become overly comfortable with one another. The affection and commitment present at the beginning of the relationship may begin to fray. Traumatic experiences during the relationship may further increase the lack of commitment from both partners.
Domestic Violence
Sadly, not every marriage is from violence. Both partners may use physical or emotional abuse to control the other’s actions. Abuse typically occurs in cycles, and if the abuser doesn’t change their ways, it may lead to a divorce.
Infidelity
Inattention to a partner’s needs or temptation to stray from a marital relationship may instigate a divorce. According to the study, 31.3 percent of divorced couples agreed that infidelity was a cause of their divorce, while 59.6 percent of individual partners said it was a big reason for the separation.
Substance Abuse
Substance abuse issues, including alcohol, drug, and pharmaceutical abuse, can lead to divorce. The substance abuser may attempt to get hold of their issue, but the risk of divorce increases after several failed efforts to control drinking or drug use.
Financial Issues
Finances can cause lots of disagreements in a marriage. Partners may disagree on the household budget, spending, or significant purchases. Per the study results, over 50 percent of partners in a divorce agree that financial issues ultimately led to their separation.
Divorce by state
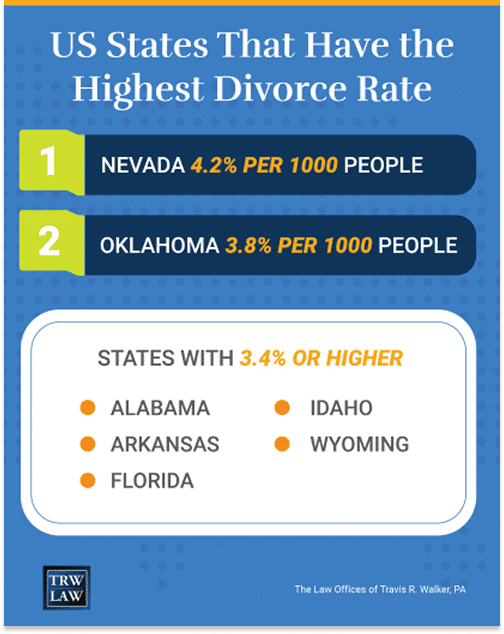
Which States Have the Highest Divorce Rate?
When it comes to divorce, where you live can impact your marriage’s long-term success. Nevada’s divorce rate of 4.2 per 1,000 people is the highest of all states, followed by Oklahoma with a divorce rate of 3.8. Other states with divorce rates of 3.4 or higher include Alabama, Arkansas, Florida, Idaho, and Wyoming.
Nevada’s high divorce rates are likely due to the state’s relaxed marriage laws. People working in the gaming industry, including casinos, typically have higher rates of divorce than other occupations. The Nevada divorce rate has been much higher than other states for several decades.
Massachusetts has the lowest divorce rate of 1.0. Other states with lower divorce rates include Illinois, Maryland, and Texas.
Occupations at risk
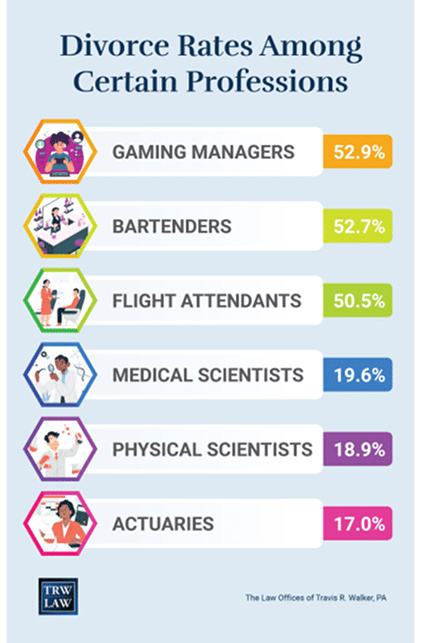
What Occupations Have the Highest Divorce Rates?
Your job may impact the longevity of your marital union. Individuals in the hospitality industry, including bartenders, gaming managers, flight attendants, and massage therapists, have higher divorce rates than other occupations. Frequent interaction with customers in a casual environment, plus long hours, may increase their risk of divorce.
Interestingly, insurance actuaries have the lowest divorce rates. Other occupations with low divorce rates include physical and medical scientists, optometrists, podiatrists, software developers, and engineers.
The divorce rates among certain professions include the following:
- Gaming managers: 52.9 percent
- Bartenders: 52.7 percent
- Flight attendants: 50.5 percent
- Medical scientists: 19.6 percent
- Physical scientists: 18.9 percent
- Actuaries: 17.0 percent
How Income Level Affects Divorce
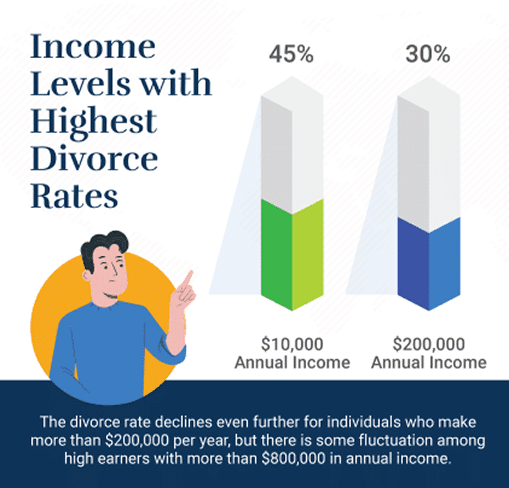
What Income Levels Have the Highest Divorce Rates?
Divorce rates by income level show that individuals earning less than $10,000 annually have the highest divorce rate—close to 45%. Divorce rates decrease as income increases, leveling off at 30% among individuals earning $200,000.
For those earning more than $200,000, the risk declines further, though high-income earners may face different relationship challenges that contribute to divorce. These figures are key when analyzing divorce rate by income trends.
The higher your income, the less risk of divorce in general. However, couples in the top earning brackets may experience different relationship complications that can result in divorce.
Children and divorce
Does Having Children Impact the Divorce Rate?
The overwhelming majority of children live with both of their parents—approximately 70 percent. However, the rate has dropped since 1968, when 85 percent of children lived in two-parent households.
Children who live only with their mothers account for 21 percent of households, up from 11 percent in 1968. Approximately 4.5 percent of children live with only their fathers, an increase from 1 percent in the late 1960s.
Just 4 percent of children live without either parent. In those cases, 55 percent live in a household with a grandparent.
Age-related divorce insights
How Does Age Affect Divorce Rates in the U.S.?
Marrying before 25 comes with a greater risk of divorce. Couples marrying between ages 25 and 32 experience higher marriage success rates. After 32, divorce risk increases incrementally every year. First-time marriages in the 40s or 50s are also at higher risk. Most common age for divorce tends to be before 25, according to statistics.
People who marry between the ages of 25 and 32 have higher marriage success rates. They may be more financially secure by that point and have developed the maturity necessary to deal with common marital issues.
However, after 32, the risk of divorce increases incrementally every year. Interestingly, first-time marriages that occur in an individual’s 40s or 50s are at higher risk of divorce. That may be because partners are quite used to the single life and struggle to deal with issues that may arise in a partnership.
Insights on marital differences
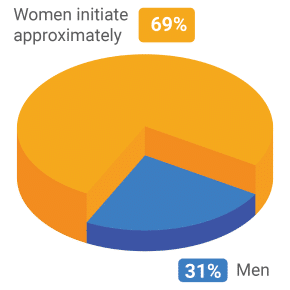
What Are the Divorce Rates by Gender?
Women initiate approximately 69 percent of divorces. They may take more of the mental load in a relationship, and frustration over marital problems may lead them to file for divorce.
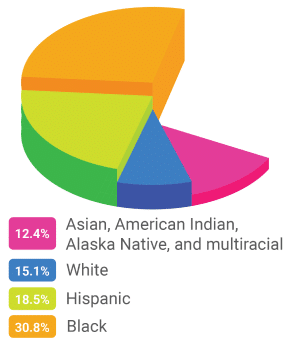
Legal insights by ethnicity
Divorce Trends Across Ethnicities
Even your ethnicity can play a factor in the success of your marriage. Here are the divorce rates per 1,000 people for different ethnicities:
- Asian, American Indian, Alaska Native, and multiracial: 12.4
- White: 15.1
- Hispanic: 18.5 percent
- Black: 30.8 percent.
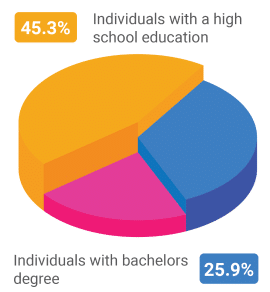
Legal perspective on education
How Does Education Level Affect Divorce Rates?
Education impacts divorce likelihood. High school graduates have a divorce rate of 45.3%, while those with a bachelor’s degree have an average divorce rate of 25.9%. These numbers are included in divorce statistics by age married and education level studies.
Guidance for healthy marriages
Tips for Having a Successful Marriage
Divorce rate statistics help shed some light on risk factors that can increase the chances of divorce, but every couple is different. You can mitigate your risk of divorce by following a few tips.
Build Good Communication Skills
Couples can argue about all kinds of things, leading to fractures in their marital relationship. Work on understanding each other’s communication styles and working toward favorable resolutions.
Put in the Effort for a Strong Relationship
Over time, your and your partner’s interests will likely change. Work on exploring new things together and be willing to expand your horizons. Shared values are the glue of a relationship. Even if your partner’s taste in music or TV shows changes over time, a commitment to each other can help you maintain a long-lasting relationship.
Consider Marital Counseling
If you notice increased fights and disagreements that you can’t seem to resolve, seek help from a professional. A marriage counselor can help you address marital issues before they overtake your relationship.
Frequently Asked Questions About Divorce Rate Statistics
What is the current divorce rate in the United States?
According to the most recent U.S. Census data and national marriage studies, the divorce rate in the United States is approximately 2.4 divorces per 1,000 people. However, divorce rates vary significantly based on factors such as age, income, education, and location.
At what age is divorce most common?
Divorce is most common among individuals who marry before the age of 25. Studies show that couples who marry between ages 25 and 32 have higher marriage success rates, while divorce risk increases gradually for marriages occurring after age 32 and for first-time marriages later in life.
Which income group has the highest divorce rate?
Individuals earning less than $10,000 per year have the highest divorce rate—nearly 45 percent. Divorce rates generally decline as income increases, leveling off at around 30 percent for individuals earning $200,000 annually or more.
Which states have the highest divorce rates?
States with the highest divorce rates include Nevada, Oklahoma, Alabama, Arkansas, Florida, Idaho, and Wyoming. Nevada consistently ranks highest, largely due to its relaxed marriage laws and workforce characteristics.